
This document is draft and has not gone through the internal editorial review process.
Appendix B: Existing
Conditions Data Analysis
List of Tables
Table 1.1 | Crash Severity Classification Scale
Table 3.1 | Crashes by Injury Severity Level (2018–2022)
Table 3.2 | Crashes by Functional Classification (2018–2022)
Table 3.3 | Crashes by Vehicle Type (2018–2022)
Table 3.4 | Crashes by Land Use (2018–2022)
Table 3.5 | Crashes by Collision Type (2018–2022)
Table 4.1 | Emphasis Area Summary (2018–2022)
Table 4.2 | Fatal & Serious Injury Crashes by Intersection Type (2018–2022)
Table 4.3 | Fatal & Serious Injury Crashes by VRU Involvement (2018–2022)
Table 5.1 | Subregion Summary (2018–2022)
Table 5.2 | Notable Subregion Emphasis Areas (2018–2022)
Table 6.1 | Top 10 Municipalities by Fatal & Serious Injury Crashes (2018–2022)
Table 6.2 | Top 10 Municipalities by Fatal & Serious Injury Crash Rate (2018–2022)
List of Figures
Figure 1.1 | Fatal and Serious Injury Crashes in the Boston Region (2018-2022)
Figure 2.1 | Long-Term Fatality Trend (1980–2022)
Figure 2.2 | Fatality Rate for Peer MPOs Compared to the Boston Region (2018–2022)
Figure 3.1 | Total Crashes by Time of Day and Day of Week (2018–2022)
Figure 3.2 | Fatal and Serious Injury Crash by Time of Day and Day of Week (2018–2022)
Figure 3.3 | Crashes by Roadway Ownership (2018–2022)
Figure 4.1 | Intersection-Related Fatal and Serious Injury Crashes (2018–2022)
Figure 4.2 | Vulnerable Road User Fatal and Serious Injury Crashes (2018–2022)
Figure 4.3 | Lane Departure Fatal and Serious Injury Crashes (2018–2022)
Figure 4.4 | Older Driver Fatal and Serious Injury Crashes (2018–2022)
Figure 4.5 | Speeding-Related Fatal and Serious Injury Crashes (2018–2022)
Figure 4.6 | Large-Vehicle-Related Fatal and Serious Injury Crashes (2018–2022)
The Boston Region Metropolitan Planning Organization (MPO) is developing a Vision Zero Action Plan to be compliant with federal Safe Streets and Roads for All (SS4A) grant program requirements for safety action plans. Key to this plan is an overview of existing conditions at the regional level, providing a snapshot of safety outcomes in recent years. The Boston Region MPO includes eight subregions and 97 municipalities. The region is made up of multiple community types , including regional urban centers, maturing suburbs, developing suburbs, and inner core communities.
To set the stage, Figure 1.1 shows fatal and serious injury crashes over the past five years in the Boston region. In all years except 2020, during which the COVID-19 pandemic lowered traffic volumes, the total number of fatal and serious injury crashes increased, rising from 918 in 2018 to 1,048 in 2022, an increase of 14 percent. The number of fatal crashes increased more severely, increasing over 45 percent to 139 fatal crashes in 2022. This is equivalent to over two MBTA buses each year and doesn’t take into account the thousands of people—family, friends, and co-workers—emotionally, financially, and mentally impacted by traffic crashes in the region.
Figure 1.1 | Fatal and Serious Injury Crashes in the Boston Region (2018-2022)
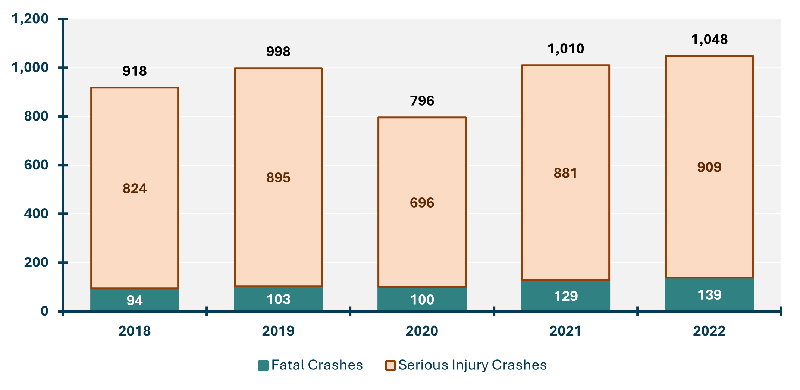
Source: MassDOT IMPACT Tool.
Note: This chart includes fatal and serious injury crashes along Interstates and other access-controlled roadways.
While many regions in America are facing increasing fatal and serious injury crash numbers, the Boston region must do its part to reverse this trend, drive these numbers toward zero fatal and serious injury crashes each year, and achieve Vision Zero.
To help reverse recent trends and put the region on the path to Vision Zero, this memorandum describes key takeaways regarding high-level crash trends and other observations from recent years. However, this memorandum is not the only source to draw from when considering future strategies and actions. Previously-developed plans such as the MassDOT Strategic Highway Safety Plan and Vulnerable Road User (VRU) Assessment , the City of Boston’s Vision Zero Action Plan , the Somerville Vision Zero Action Plan , the Cambridge Vision Zero Action Plan , the Town of Dedham’s Local Road Safety Plan, the Town of Weymouth’s Safety Action Plan , the City of Salem’s Safe Streets for All Action Plan , and other local safety plans in the region as well as programs such as the MassDOT Highway Safety Improvement Plan and Boston Region Transportation Improvement Program all lend valuable insights to the region’s safety picture. Insights from this memorandum and other plans will be used by the MPO to understand patterns of crashes and common risk factors, to develop crash profiles, and to inform strategies and actions to address those risk factors.
The primary source of data in this report is crash data from the MassDOT Open Data Portal and the MassDOT IMPACT tool, a tool for researching, querying, and downloading crash-related data in the Commonwealth. The most recent 10 years of cleaned and processed data were downloaded (2013–2022), but most of the trends discussed in this report analyze data from the most recent five years of available data (2018–2022) to focus on recent crash trends.
The crash dataset cannot capture crashes that were not reported to police and is subject to inconsistencies in reporting practices across the region. While there are known issues with the crash data, particularly within the City of Boston and City of Waltham, the MPO worked under the assumption that the majority of data was correct and suitably accurate to tell the story of crash trends in the region.
Because the recording of crash data attributes and categories evolved throughout the study period, assumptions had to be made to ensure consistency among injury classification schemes (represented in the data by the Maximum Injury Severity Reported field). For the purposes of this report, crashes are categorized into the KABCO scale, a common injury severity scale. Definitions for each level of the KABCO scale as well as which values in the Maximum Injury Severity Reported field correspond to each level are described below in Table 1.1. Judgements in injury severity are normally made by the reporting officer responding to the crash and cleaned and processed by staff when entered into the MassDOT database.
Table 1.1 | Crash Severity Classification Scale
| KABCO Category |
Definition |
Corresponding Values in MassDOT Crash Data |
|---|---|---|
Fatal Injury (K) |
Any injury that results in death due to the crash.1 |
|
Suspected Serious Injury (A) |
Any injury that prevents the injured person from normally continuing activities that person was capable of before the injury occurred, such as a severe laceration or a broken limb. |
|
Suspected Minor Injury (B) |
Any visible injury that is not a suspected serious injury, such as a lump on the head or minor lacerations. |
|
Possible Injury (C) |
Any injury reported by an individual involved in the crash, but not visible to the reporting officer, such as dizziness or a complaint of pain. |
|
No Apparent Injury (O) |
Used when there is no evidence of physical injury and the individuals involved in the crash do not complain of any possible injury. |
|
Not Reported or Unknown |
Used when the injury severity is unknown. |
|
1 Crash report data indicate that some people passed away during crash crashes, but not as a result of the crash. These are coded as “Deceased not caused by crash” in the MassDOT IMPACT data and are not included in this analysis.
After cleaning and standardizing the injury severity information, all crashes on Interstates, expressways, other fully access-controlled roadways, and ramps were filtered and removed from the dataset.1 This represented 16 percent of fatal and serious injury crashes from 2018 to 2022. By concentrating on non-access controlled roads, Vision Zero initiatives can more effectively address the areas where interventions are most needed and can have the greatest impact on reducing traffic-related fatalities and serious injuries. For this reason, all crash breakdowns and analysis in this report do not include crashes along Interstates, expressways, other fully access-controlled roadways, or ramps unless otherwise noted. Additionally, location information, such as the crash municipality, community type, and subregion, was joined to the crashes.2
Outside of the MassDOT IMPACT tool, historical data from the Fatality Analysis Reporting System (FARS) were collected to analyze long-term fatality trends at a timescale not available in the MassDOT IMPACT tool and compare the MPO region to peer MPOs. This dataset is not able to be filtered to consistently remove crashes along access-controlled roadways.
This section uses data from FARS to analyze overall fatality trends in for the region. This is done by looking at long-term fatality trends and by comparing the region’s fatality rates to peer areas.
Analyzing long-term fatality trends helps tell the story of the region’s progress on safety over time, which can inform future progress. Previous advances in transportation safety technology, such as the rising usage of seat belts, airbags, and more considerate vehicle design, helped drive fatality numbers down in the region.3 New technological advances complemented by effective investments in other areas, such as vehicle design, self-enforcing roadway design, education, and “right-sized” enforcement, will assist the region in its pursuit to reach Vision Zero.
Later in this section, the Boston region is compared to similar regions in other states. This comparison is shown to benchmark the region and to encourage future communication of best practices and lessons learned between the MPO and its peer organizations. Given the Federal Highway Administration’s (FHWA) commitment to zero deaths, the vision of no roadway fatalities is shared by the entire country and applicable to each MPO.4
The rest of this section goes into more detail, key takeaways for this section include the following:
Key Takeaways
The historical fatality data from FARS are shown in Figure 2.1. The data in this figure are smoothed with a five-year rolling average to account for the inherent randomness in fatal crashes and to make long-term trends easier to observe. Data points every five years are labeled.
Between 1980 and 2022, the five-year average of Boston region fatalities experienced a general downward trend, decreasing by 68 percent over the entire time period. From 1980-2000, fatalities decreased at a rate of approximately 10 fatalities fewer per year on average. Since 2000, the rate of decline in fatalities slowed dramatically to approximately one fatality fewer per year on average. The trend of fatality rates declining over time is fairly consistent, with exceptions in the periods between 1987-1989, 2000-2004, and most recently in 2020-2022.
Figure 2.1 | Long-Term Fatality Trend (1980–2022)
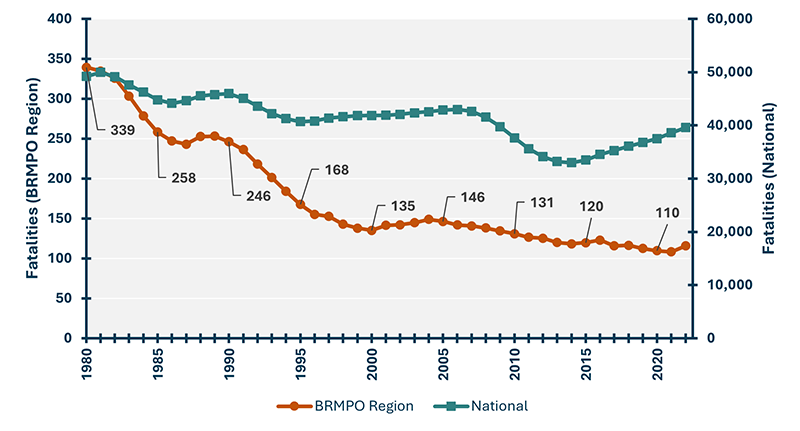
Source: Fatality Analysis Reporting System (FARS), National Highway Traffic Safety Administration (NHTSA).
Note: Data from FARS and MassDOT IMPACT tool may not match exactly due to data processing discrepancies. Data from FARS also include fatalities on Interstates and access-controlled roads.
This trend for the region compares favorably to the national trend, seen in Figure 2.1. Nationally, according to FARS, fatalities decreased approximately 17 percent from 1980 to 2022, a much smaller decrease than the 68 percent seen in the region. Additionally, the national fatality numbers have constantly increased in the past decade, increasing by 20 percent from 2014 to 2022. In the same time period, the numbers have marginally decreased in the region.
If the fatality numbers in the region continue to decrease at a rate similar to 1980-2000, the region would reach Vision Zero in the next 10-15 years. If fatalities continue to decrease at a rate similar to the past two decades, the region will not reach Vision Zero for another 100 years. Effective and strategic investments must be made in transportation safety to reverse the plateaued trend of recent years and enable the region to reach Vision Zero.
Despite the challenges outlined above, the region maintains some of the lowest fatality rates among peer metropolitan areas. The following metropolitan areas were analyzed using fatality data from FARS and population data from the US Census Bureau to develop fatality rates per population.
Peer MPOs were chosen based on proximity (all MPOs are in the mid-Atlantic or New England regions), similar sizes, and land use patterns.
Figure 2.2 shows the fatality rate, measured in fatalities per 100,000 residents, from 2018 to 2022. Among these peers, the Baltimore and Philadelphia regions average between 7 and 8 fatalities per 100,000 residents, the Washington and Providence regions average between 5 and 6, and New York City and Boston average between 3 and 4. The Boston region has the lowest fatality rate out of all these peers, and its 2023 fatality rate is approximately 3.5 fatalities per 100,000 people.
Boston is most similar to New York, both in terms of rate of fatalities and recent trends. Both regions saw decreases from 2018 to 2021 before increasing slightly in 2022. Because of these similarities, Boston may want to study some of the Vision Zero actions taken by the New York City region. Boston may also consider some of the more recent safety strategies from Providence, as the Providence region was the only region to experience a recent downward trend in fatality rate, decreasing from approximately 6 fatalities per 100,000 residents in 2021 to just under 5.5 in 2022.
Regardless of their peers, the region’s low fatality rates show that current safety strategies are making an impact. In addition to studying other regions, the region should expand upon its proven programs for crash reduction and continue its existing Vision Zero work to eventually meet the Vision Zero goal.
Figure 2.2 | Fatality Rate for Peer MPOs Compared to the Boston Region (2018–2022)
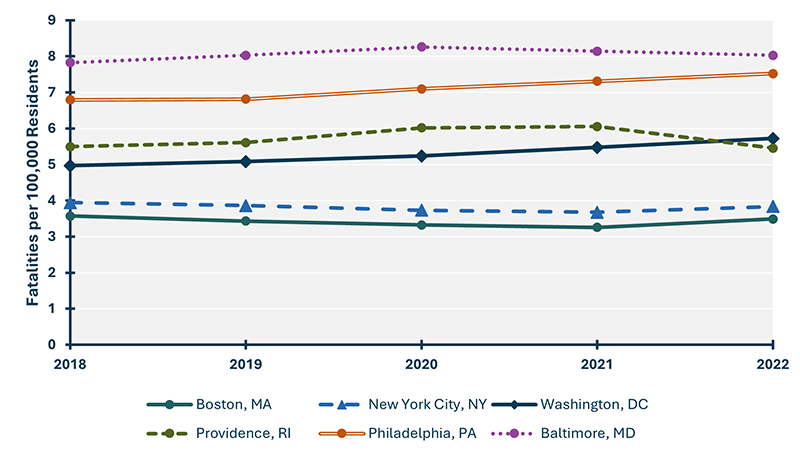
Source: Fatality data from FARS, NHTSA. Population data from the American Community Survey, US Census Bureau.
Note: Data from FARS include fatalities on Interstates and access-controlled roads.
While long-term historical trends are important for setting the stage and telling the overall story of safety in the region, the specific contributing factors for those crashes can change over time. This section reviews and breaks down more recent crash data to identify current contributing factors linked to the most common and highest density crash types.5 Crashes are analyzed by severity, by time of day and year, by roadway type and ownership, and by other factors to help predict factors that may lead to more crashes in the future.
These breakdowns, combined with the emphasis area analysis in Section 4, will help the region focus on the most vital and over-represented crashes and will enable the region to prioritize solutions, strategies, and actions to maintain progress on the road to Vision Zero.
Key takeaways for this section include:
Key Takeaways
From 2018 to 2022, a total of 188,683 roadway crashes occurred in the region, with 2 percent (3,986 crashes) resulting in fatalities or serious injuries. Overall, less severe crashes (KABCO injury severity levels C and O) accounted for more than 85 percent of total crashes.
To quantify the economic impact of crashes, cumulative crash costs were calculated for each severity level using the 2024 recommended comprehensive crash unit costs developed by MassDOT for highway safety analysis.6 These cumulative costs include both direct economic costs (e.g., medical expenses, emergency services, congestion costs) and quality-adjusted life years values, which estimate the societal and individual impacts of reduced health and lifespan due to crashes.
Table 3.1 summarizes the total number of crashes by severity level, along with the crash unit cost and corresponding cumulative crash costs for the region between 2018 and 2022. Over this period, crashes incurred an estimated total cost of $26.5 billion, averaging around $5.3 billion per year. Fatal and serious crashes make up over 46 percent of these crash costs alone. Evenly distributing the cost of crashes among residents of the region would result in crashes costing each resident over $1,500 each year.
Table 3.1 | Crashes by Injury Severity Level (2018–2022)
| Maximum Injury Severity Level |
Number of Crashes |
% of Total Crashes |
Comprehensive Crash Unit Cost |
Cumulative Crash Cost |
% of Cumulative Crash Cost |
|---|---|---|---|---|---|
Fatality (K) |
427 |
0.2% |
$19,435,000 |
$8,299 M |
31.3% |
Suspected Serious Injury (A) |
3,559 |
1.9% |
$1,112,900 |
$3,961 M |
15.0% |
Suspected Minor Injury (B) |
21,338 |
11.3% |
$354,100 |
$7,556 M |
28.5% |
Possible Injury (C) |
18,745 |
9.9% |
$208,000 |
$3,899 M |
14.7% |
No Apparent Injury (O) |
132,315 |
70.1% |
$20,900 |
$2,765 M |
10.4% |
Other/Unknown |
12,299 |
6.5% |
- |
- |
- |
Total |
188,683 |
100.0% |
- |
$26,480 M |
100.0% |
Source: Crashes from the MassDOT IMPACT Portal; Crash costs from Crash Costs for Highway Safety Analysis, MassDOT.
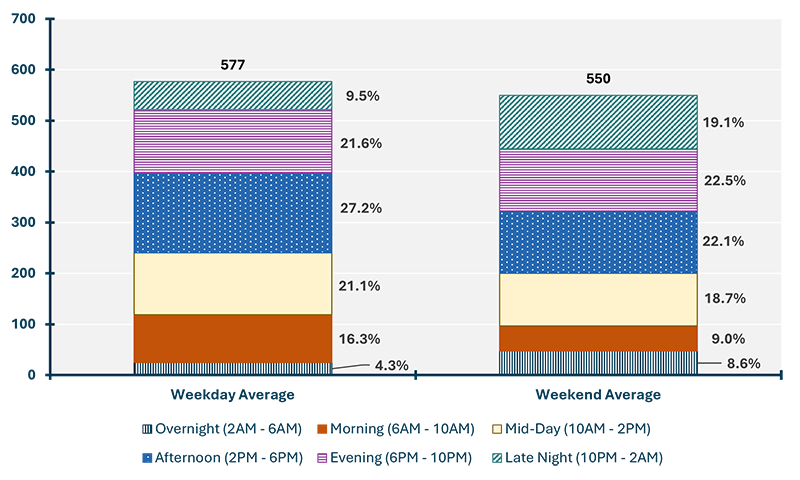
Travel behaviors and crash frequency are correlated with time of day and day of the week. The total amount of vehicle miles traveled (VMT), and therefore, the opportunities for crashes, is generally greater on weekdays when people are driving to and from jobs compared to the weekend. Additionally, while more people drive during daytime hours, the lack of adequate lighting conditions and lower amounts of traffic can lead to higher speeds and severe crashes at night.7
To better understand the temporal crash patterns, the day was further divided into six four-hour periods. Figure 3.1 and Figure 3.2 show the distribution of total crashes as well as fatal and serious injury crashes across these time periods by day of week. Weekday afternoon periods (2 PM to 6 PM) experienced the highest fatal and serious injury crash frequency, closely followed by weekday morning periods (6 AM to 10 AM). Given that both periods include peak commuting times, the high crash frequency is likely attributable to higher traffic volumes and increased traffic congestion.
While 28 percent of all roadway crashes occurred during evening, late night, or overnight hours (6 PM to 6 AM), 40 percent of the fatal and serious injury crashes occurred during the same time period. This suggests that while more crashes happen in the daytime, nighttime crashes are more likely to result in severe outcomes. Despite the overwhelming majority of these fatal and serious injury crashes happening when the sun is down, only 7 percent of crashes in this time period occurred in dark unlighted areas compared to 70 percent occurring during dark lighted areas. This indicates that, while lighting is an important contributing factor in nighttime crashes, it’s not the only contributing factor. Outside of lighting, the prevalence of drivers under the influence is correlated with nighttime crashes. During these hours, drivers under the influence are eight times more likely (13 percent) to be a cause of a fatal or serious injury crash compared to daytime hours (2 percent), per MassDOT IMPACT data.
Figure 3.1 | Total Crashes by Time of Day and Day of Week (2018–2022)
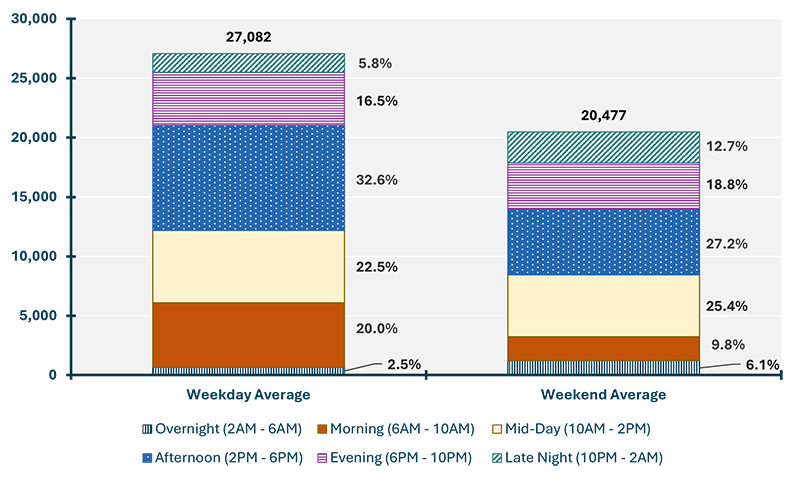
Source: MassDOT IMPACT Portal.
Figure 3.2 | Fatal and Serious Injury Crash by Time of Day and Day of Week (2018–2022)
Source: MassDOT IMPACT Portal.
One method to classify roadway types is by functional classification, which is a hierarchy of road types that serve different needs. Arterials are generally main thoroughfares that limit cross-traffic and are often controlled by traffic signals, while collectors generally serve to funnel traffic from local roads on to the arterials. Local roads serve individual houses and neighborhoods and make up the largest percentage of roadways by mileage, but often see the lowest traffic volumes and lowest average speeds. Analyzing crashes by roadway type influences further systemic analysis of crashes and can help the MPO put together packages of systemic roadway projects.
Between 2018 and 2022 in the region, principal arterials accounted for the largest share of both total crashes (42 percent) and fatal and serious injury crashes (38 percent). However, minor arterials showed a disproportionately higher percentage of fatal and serious injury crashes (33 percent) compared to their share of total crashes (28 percent).Table 3.2 presents a detailed breakdown of fatal and serious injury crashes, total crashes, and fatal and serious injury crashes with VRUs involved by functional classification.8
Regarding fatal and serious injury crashes that involved at least one VRU, while principal arterials still accounted for the plurality (39 percent), these crashes were more likely to occur on local roads (16 percent vs. 14 percent) and less likely on minor arterials (30 percent vs. 33 percent) compared to fatal and serious injury crashes where no VRUs were involved.
Table 3.2 also normalizes these crash breakdowns by the centerline mileage of roadways in each functional classification. All types of crashes, regardless of severity of VRU-involvement, occur at a greater rate per mile on principal arterials and minor arterials. Two times the amount of crashes per mile are likely to occur on minor arterials compared to major collectors, and two times the amount of crashes per mile are likely to occur on principal arterials compared to minor arterials. This is likely due to the higher vehicle volumes and therefore more opportunities for crashes on roadways of higher functional classifications.
Table 3.2 | Crashes by Functional Classification (2018–2022)
| Functional Classification |
All Crashes |
Fatal & Serious Injury Crashes |
All VRU Crashes |
Fatal & Serious Injury VRU Crashes |
||||||||
|---|---|---|---|---|---|---|---|---|---|---|---|---|
| Number |
% of Total |
By Mileage |
Number |
% of Total |
By Mileage |
Number |
% of Total |
By Mileage |
Number |
% of Total |
By Mileage |
|
Principal Arterial |
74,122 |
42.0% |
89.2 |
1,518 |
38.1% |
1.8 |
3,153 |
39.7% |
3.8 |
428 |
38.9% |
0.51 |
Minor Arterial |
50,317 |
28.5% |
35.3 |
1,303 |
32.7% |
0.9 |
2,263 |
28.5% |
1.6 |
326 |
29.7% |
0.23 |
Major Collector |
22,192 |
12.6% |
17.4 |
586 |
14.7% |
0.5 |
1,054 |
13.3% |
0.8 |
160 |
14.6% |
0.13 |
Minor Collector |
74 |
0.0% |
6.0 |
1 |
0.0% |
0.1 |
1 |
0.0% |
0.1 |
0 |
0.0% |
0.00 |
Local |
28,220 |
16.0% |
3.6 |
541 |
13.6% |
0.1 |
1,422 |
17.9% |
0.2 |
177 |
16.1% |
0.02 |
Unknown |
1,321 |
0.7% |
- |
35 |
0.9% |
- |
55 |
0.7% |
- |
8 |
0.7% |
- |
Total |
176,384 |
100.0% |
15.6 |
3,986 |
100.0% |
0.4 |
7,951 |
100.0% |
0.7 |
1,099 |
100.0% |
0.10 |
Source: MassDOT IMPACT Portal.
Note: The By Mileage column equates to the number of crashes divided by the centerline mileage of roadways in that functional classification.
Note: As noted in the Data Sources & Processing section, fully access-controlled roadways, which includes Interstates and Principal Arterials—Other Freeways & Express, were removed from this analysis and are not shown in this table.
Vision Zero can only be achieved in the Boston region by coordinating among many jurisdictions, law enforcement agencies, and separate roadway owners. Analyzing crashes by roadway ownership can help guide these discussions and can help justify additional attention and support from over-represented roadway owners.
Figure 3.3 illustrates the distribution of crashes among different roadway owners. Between 2018 and 2022, the majority of crashes at 71 percent occurred on roads under municipal jurisdiction, followed by those owned by MassDOT at 20 percent, and the Department of Conservation and Recreation (DCR) at 5 percent.9
Figure 3.3 | Crashes by Roadway Ownership (2018–2022)
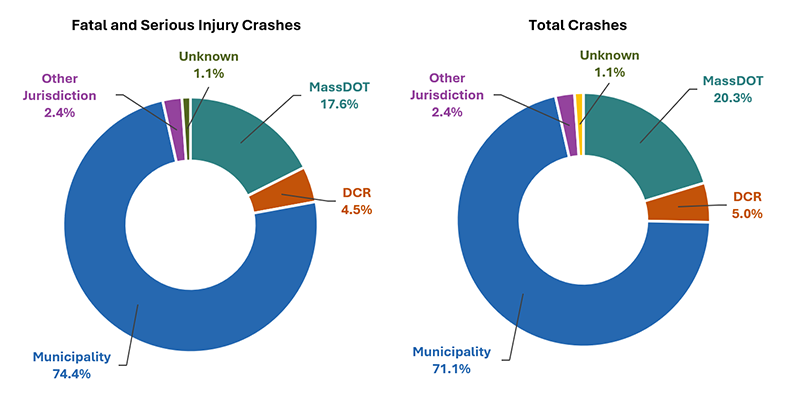
Source: MassDOT IMPACT Portal.
Notably, a crash on a municipality-owned road was more likely to result in a fatality or serious injury (2.4 percent) compared to the likelihood observed on roads under MassDOT (2 percent) and DCR (2 percent) ownership. This suggests that there may be specific safety challenges for locally-managed roads. These safety challenges on locally-managed roads include:
To understand the impact of vehicle type on crash severity, the distribution of total crashes and fatal and serious injury crashes was analyzed over the five-year period, as shown in Table 3.3. Passenger cars, which accounted for the 96 percent of the region’s annual VMT, were the most frequently involved vehicle type and are involved in 75 percent of fatal and serious injury crashes.10 Trucks followed at 35 percent.
The analysis of crashes involving motorcyclists reveals that motorcyclists have the highest vulnerability among all vehicle types, with 83 fatal and serious injury crashes per 100 million VMT on average. Due to various factors such as lack of external protection and inherent vehicle instability, the rate of fatal and serious injury crashes for motorcycles was approximately 30 times greater than the 2.8 per 100 million VMT observed for passenger cars. This underscores the importance of targeted interventions such as education programs promoting helmet use and other safe riding behaviors.
Table 3.3 | Crashes by Vehicle Type (2018–2022)
| Vehicle Type |
All Crashes |
Fatal & Serious Injury Crashes |
Fatal & Serious Injury VRU Crashes |
||||||
|---|---|---|---|---|---|---|---|---|---|
| Number |
% of Total |
Rate per 100 Million VMT |
Number |
% of Total |
Rate per 100 Million VMT |
Number |
% of Total |
Rate per 100 Million VMT |
|
Passenger Car |
148,412 |
84.1% |
142 |
2,977 |
74.7% |
2.8 |
713 |
64.9% |
0.7 |
Motorcycle |
2,169 |
1.2% |
433 |
418 |
10.5% |
83.4 |
9 |
0.8% |
1.8 |
Truck |
69,271 |
39.3% |
2,187 |
1,389 |
34.8% |
43.9 |
366 |
33.3% |
11.6 |
Bus |
2,079 |
1.2% |
391 |
37 |
0.9% |
7.0 |
10 |
0.9% |
1.9 |
Other |
401 |
0.2% |
113 |
44 |
1.1% |
12.4 |
9 |
0.8% |
2.5 |
Unknown/Not Reported |
263 |
0.1% |
- |
31 |
0.8% |
- |
25 |
2.3% |
- |
Total |
176,384 |
- |
162 |
3,986 |
- |
3.7 |
1,099 |
- |
1.0 |
Source: MassDOT IMPACT Portal.
Note: A single crash may have involved more than one type of vehicle, so the Total row will be not equal the sum of all the rows above it.
Analyzing crashes by land use is crucial for understanding how the built environment influences roadway safety. Different land uses create distinct roadway designs, traffic patterns, and user behaviors, all of which can significantly impact the frequency and severity of crashes.
Table 3.4 shows that within urbanized areas, commercial areas had the highest proportion of fatal and serious injury crashes (30 percent), potentially due to high volumes of vehicles, pedestrians, and delivery trucks. This trend is particularly pronounced in high-density business/commercial centers, where 38 percent of fatal and serious injury crashes in those areas involved VRUs and 39 percent involved light trucks. This indicates the potential need for roadway safety improvements, including safer pedestrian crosswalks, dedicated bike lanes, and improved intersection designs.
In addition, high-density residential areas exhibited a high involvement of light trucks in fatal and serious injury crashes (41 percent) and had the highest proportion of fatal and serious injury crashes compared to all crashes (3 percent). This significant light truck presence poses a great potential risk to VRUs and severe crashes, especially considering the high levels of pedestrian and bicycle activity typical of these areas.
Table 3.4 | Crashes by Land Use (2018–2022)
| Reported Land Use |
Fatal & Serious Injury Crashes |
Fatal & Serious Injury VRU Crashes |
Fatal & Serious Injury Crashes Involving Light Trucks |
||||
|---|---|---|---|---|---|---|---|
| Number |
% of Total |
Proportion of Crashes that Result in a Fatality or Serious Injury |
Number |
% of Land Use’s Total Fatal & Serious Injury Crashes |
Number |
% of Land Use’s Total Fatal & Serious Injury Crashes |
|
High-density business/commercial center |
136 |
15.1% |
2.5% |
52 |
38.2% |
53 |
39.0% |
High-density residential (5,000 or more persons per square mile) |
116 |
12.9% |
2.8% |
26 |
22.4% |
47 |
40.5% |
Low-density commercial |
136 |
15.1% |
1.6% |
48 |
35.3% |
46 |
33.8% |
Low-density residential (less than 5,000 persons per square mile) |
86 |
9.5% |
1.7% |
13 |
15.1% |
31 |
36.0% |
Not applicable (i.e., not a principal arterial nor in an urbanized area) |
303 |
33.6% |
1.7% |
94 |
31.0% |
91 |
30.0% |
Other urban area, including undeveloped land |
124 |
13.8% |
1.6% |
24 |
19.4% |
30 |
24.2% |
Total |
901 |
100.0% |
1.8% |
257 |
28.5% |
298 |
33.1% |
Source: MassDOT IMPACT Portal.
Note: Land use information is taken from the Urban Location Type field from the MassDOT IMPACT Portal. Land use information is only available for a subset (22 percent) of fatal and serious injury crashes. This table only displays that subset.
Since different crash types are often associated with certain roadway conditions and driver behaviors, the analysis of collision types can help provide insights into the underlying contributing factors and the according safety countermeasures.
As shown in Table 3.5, while the most common crash types were angle crashes (29 percent) and rear-end crashes (26 percent), single-vehicle crashes had the highest share of fatal and serious injury crashes (40 percent), making them the crash type with the second highest risk of fatalities and serious injuries. Although head-on crashes were less frequent, they posed the greatest risk for severe outcomes, as the vehicle impact forces involved in the crash were typically much stronger compared to other multi-vehicle crash types.
Table 3.5 | Crashes by Collision Type (2018–2022)
| Collision Type |
Number of Fatal & Serious Injury Crashes |
% of Fatal & Serious Injury Crashes |
Number of Total Crashes |
% of Total Crashes |
Proportion of Fatal & Serious Injury Crashes |
|---|---|---|---|---|---|
Single vehicle crash |
1,588 |
39.8% |
33,835 |
19.2% |
4.7%1 |
Rear-end |
436 |
10.9% |
46,388 |
26.3% |
0.9% |
Angle |
1,003 |
25.2% |
51,365 |
29.1% |
2.0% |
Sideswipe, same direction |
174 |
4.4% |
22,530 |
12.8% |
0.8% |
Sideswipe, opposite direction |
102 |
2.6% |
6,461 |
3.7% |
1.6% |
Head-on |
476 |
11.9% |
6,016 |
3.4% |
7.9%1 |
Rear-to-rear |
8 |
0.2% |
1,363 |
0.8% |
0.6% |
Other |
97 |
2.4% |
5,879 |
3.3% |
1.6% |
Unknown/Not Reported |
102 |
2.6% |
2,547 |
1.4% |
4.0% |
Total |
3,986 |
100.0% |
176,384 |
100.0% |
2.3% |
Source: MassDOT IMPACT Portal.
1 Percentages indicate a high risk of fatal and serious injury crashes.
Among the single-vehicle fatal and serious injury crashes, the most common first harmful events were collisions with pedestrians (35 percent), followed by collisions with utility poles (15 percent) and curbs (8 percent). The high proportion of pedestrian involvement in single-vehicle fatal or serious injury crashes indicates potential concerns such as drivers leaving the roadway due to impairment, distraction, or excessive speeds, and encroaching onto sidewalks. These findings suggest the potential need for infrastructure improvement, such as protected sidewalks, as well as increased public awareness of safer driving behavior, particularly in areas with high pedestrian activity.
In conjunction with the analyses completed in Section 3, summarizing crashes by emphasis areas will further narrow the focus on specific crash types and assist in the prioritization of investments in the region. The Massachusetts Highway Safety Improvement Program (HSIP) identifies emphasis areas for the entire Commonwealth.11 Paired with the conclusions from Section 3, these emphasis areas are a helpful framework for identifying common crash issues, analyzing contributing factors, and linking them with a set of countermeasures and strategies.
Key takeaways for this section include:
Key Takeaways
Emphasis areas studied in this plan include the following:
More specific information, including the exact queries used to filter to these emphasis areas, are available on MassDOT’s website .
Table 4.1 lists the fatal and serious injury crashes for each emphasis area for both the Boston region and the Commonwealth of Massachusetts, the percentage of total fatal and serious injury crashes within each emphasis area, and the change in fatal and serious injury crashes from 2018 to 2022. Emphasis areas that are notably more prevalent in the region compared to the Commonwealth are highlighted in red.
To narrow the focus of this analysis, the following six emphasis areas emerged as key emphasis areas to address in the Boston Region Vision Zero Action Plan.
The Intersections, Lane Departure, and Older Drivers emphasis areas were the top three emphasis areas in terms of the percentage of the region’s fatal and serious injury crashes. Given Vision Zero’s focus on the safety of people outside of vehicles, the Pedestrian and Bicyclist emphasis areas were combined for a VRU emphasis area. When these categories are combined, the VRU emphasis area is the second most-prevalent emphasis area by crash percentage. Additionally, Intersections, both VRU categories, and Older Drivers were over-represented when compared to the rest of Massachusetts. All of these emphasis areas represent over 20 percent of fatal and serious injury crashes in the region each.
In addition to the above emphasis areas, the Large Vehicles emphasis area was also over-represented compared to the rest of the Commonwealth. While these crashes only contribute to 5 percent of fatal and serious injuries in the region, this emphasis was consistently noted by key regional stakeholders as an important focus moving forward.
The Speeding emphasis area, while not one of the emphasis areas with the largest number of fatal and serious injury crashes, was one of the fastest growing areas over the past five years. Speeding-related fatal and serious injury crashes increased by over 90 percent from 2018 to 2022, which is the second-fastest growing emphasis area except for bicyclists. Additionally, high vehicle speeds was mentioned repeatedly as a key issue by stakeholders. Because of the recent high growth of this emphasis area and the feedback of stakeholders, Speeding emerged as the final emphasis area.
Despite the fact that the other emphasis areas were not selected as part of the key emphasis area list, this does not mean they are not important for the region and individual municipalities to focus on when thinking about how to improve roadway safety. Strategies and actions in the plan will still relate and address these emphasis areas, as several are interconnected. The focus of the majority of the strategies and actions in the Vision Zero Action Plan, however, will be on the key emphasis areas.
Table 4.1 | Emphasis Area Summary (2018–2022)
| Massachusetts HSIP |
Boston Region |
Massachusetts |
|||
|---|---|---|---|---|---|
| Number of Fatal & Serious Injury Crashes |
% of Total Fatal & Serious Injury Crashes |
Percent Change from 2018 to 2022 |
% of Total Fatal & Serious Injury Crashes |
Percent Change from 2018 to 2022 |
|
Intersections |
1,756 |
44.1% |
7.0% |
39.7% |
15.6% |
Lane Departure |
842 |
21.1% |
42.8% |
25.9% |
37.7% |
Older Drivers |
837 |
21.0% |
23.5% |
20.0% |
18.5% |
Pedestrians |
781 |
19.6% |
-3.9% |
14.9% |
11.0% |
Younger Drivers |
449 |
11.3% |
53.7% |
12.7% |
52.2% |
Motorcyclists |
424 |
10.6% |
62.9% |
14.5% |
58.6% |
Distracted Driving |
314 |
7.9% |
36.5% |
8.9% |
23.4% |
Bicyclists |
300 |
7.5% |
92.3% |
5.1% |
60.9% |
Impaired Driving |
277 |
6.9% |
23.9% |
8.3% |
48.0% |
Large Vehicles |
215 |
5.4% |
20.0% |
5.3% |
27.2% |
Speeding |
205 |
5.1% |
90.6% |
6.6% |
84.8% |
Occupant Protection |
182 |
4.6% |
37.5% |
4.8% |
15.0% |
Source: Data Query and Visualization from MassDOT IMPACT Portal.
Note: Percentages bolded in red are greater than the corresponding percentage in the entire Commonwealth of Massachusetts. Data in Table 4.1 does not include crashes along Interstates, expressways, other fully access-controlled roadways, or ramps.
Because of their outsized importance, deeper dives into the contributing factors of the six key emphasis areas are provided below to better tailor the strategies and actions of the region’s plan.
Intersection crashes include those crashes that are directly located within intersections or related to the operation of intersection approaches. These are critical points of conflict among various road users, including motorized vehicles, pedestrians, and cyclists, leading to a high incidence of crashes.
Among all the identified emphasis areas, intersection-related crashes were the most common type of fatal and serious injury crashes from 2018 to 2022, contributing to 44 percent of the region’s total. While these crashes were slightly over-represented compared to the statewide percentage of 40 percent, they remained relatively stable at just under 400 per year over the five-year period, except for a brief decline in 2020, likely due to reduced traffic volumes during the pandemic. By 2022, these crashes had increased by 7 percent compared to 2018, a much slower rate than the statewide increase of 16 percent.
Figure 4.1 | Intersection-Related Fatal and Serious Injury Crashes (2018–2022)
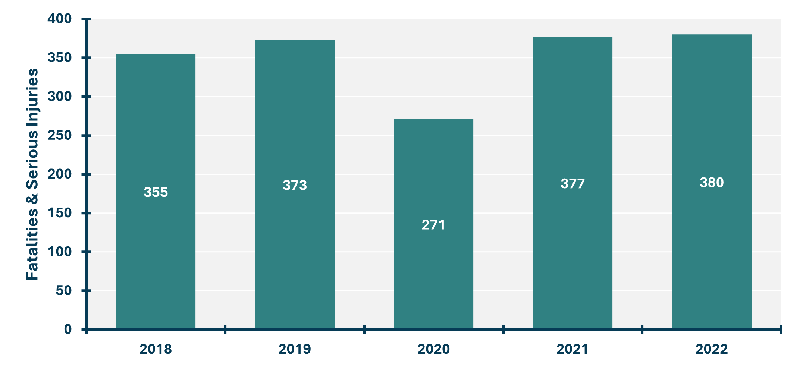
Source: MassDOT IMPACT Portal.
Given the distinct safety challenges posed by each intersection's unique combination of geometry, configuration, and traffic control, intersection-related crashes were further analyzed by intersection type and traffic control type. As indicated in Table 4.2, four-way intersections and T-intersections accounted for the majority (94 percent) of fatal and serious injury intersection crashes. Additionally, the proportion of fatal and serious injury crashes relative to total intersection crashes increased with the number of intersection approaches, likely due to increased complexity of intersection configurations.
Table 4.2 | Fatal & Serious Injury Crashes by Intersection Type (2018–2022)
| Intersection Type |
Number of Fatal & Serious Injury Crashes |
% of Fatal & Serious Injury Intersection Crashes |
Proportion of Crashes that Resulted in a Fatality or Serious Injury |
|---|---|---|---|
Y-Intersection |
81 |
4.6% |
1.9% |
T-Intersection |
812 |
46.2% |
2.3% |
Four-way Intersection |
837 |
47.7% |
2.4% |
Five-Point or More |
26 |
1.5% |
2.4% |
Total |
1,756 |
100.0% |
2.3% |
Source: MassDOT IMPACT Portal.
Among fatal and serious injury crashes at T-intersections and four-way intersections, nearly half (45 percent) occurred at signalized intersections, followed by 32 percent at uncontrolled intersections. To enhance intersection safety, potential countermeasures include optimizing signal timing, prohibiting right turns on red, or converting conventional intersections to roundabouts. The selection of specific interventions should consider factors such as location, traffic volumes, and the walkability of the surrounding area.
VRUs face unique challenges and a higher risk of injury compared to other road users. While walking and biking can offer significant health and environmental benefits, VRUs are more susceptible to serious injuries and fatalities when involved in collisions with motor vehicles. From 2018 to 2022, while VRU crashes accounted for only 5 percent of total roadway crashes, they made up 27 percent of fatal and serious injury crashes within the region. If a VRU is involved in a crash, they are eight times more likely to be killed or seriously injured compared to a person in a vehicle.
Table 4.3 | Fatal & Serious Injury Crashes by VRU Involvement (2018–2022)
| VRU Involvement |
Number of Fatal & Serious Crashes |
% of Fatal & Serious Injury Crashes |
Number of Total Crashes |
% of Total Crashes |
Proportion of Crashes that Resulted in a Fatality or Serious Injury |
|---|---|---|---|---|---|
VRU-Involved |
1,058 |
27% |
7,951 |
5% |
13.3% |
Non-VRU-Involved |
2,908 |
73% |
168,433 |
95% |
1.7% |
Total |
3,986 |
100% |
176,384 |
100% |
2.3% |
Source: MassDOT IMPACT Portal.
Note: Numbers in the Total row may differ from other tables and figures due to inconsistent data availability for certain fields.
Figure 4.2 illustrates the annual number of fatal and serious injury crashes involving pedestrians and bicyclists over a five-year period. Between 2020 and 2022, these crashes steadily increased from 177 to 252, a 42.4% growth in just three years. This upward trend is consistent with the overall pattern observed across Massachusetts. However, the rate of increase in the region was more pronounced, particularly for crashes involving bicyclists, which saw a substantial 90.6% rise compared to the 60.9% increase experienced statewide. It is unclear whether this substantial rise is due to a decrease in VRU safety conditions or due to an increased use of active transportation and more exposure for VRUs.
Figure 4.2 | Vulnerable Road User Fatal and Serious Injury Crashes (2018–2022)
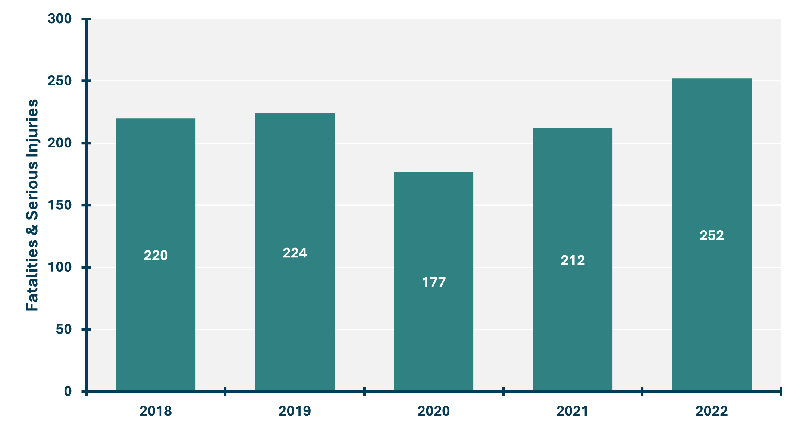
Source: MassDOT IMPACT Portal.
A deeper analysis of VRU fatal and serious injury crashes reveals contributing factors.
A lane departure crash, as defined by FHWA, is a crash that occurs after a vehicle crosses an edge line or a center line or otherwise leaves the traveled way. Besides intersection crashes and VRU crashes, lane departures are the third leading cause of fatal and serious injury crashes both statewide and within the region.
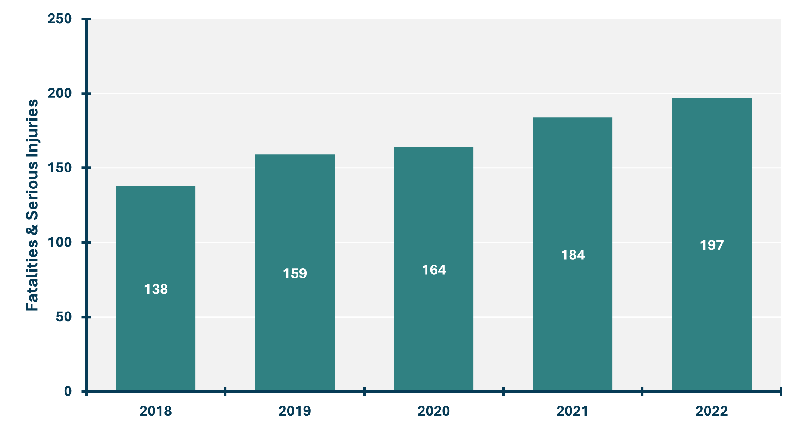
Between 2018 and 2022, lane departure crashes accounted for 21 percent of fatal and serious injury crashes in the region, despite comprising only 4 percent of all crashes. This significant disparity highlights the high severity potential of lane departure crashes. Like the statewide upward trend, fatal and serious injury lane departure crashes in the region gradually increased from 138 in 2018 to 197 in 2022, a 43 percent rise over five years, comparable to the statewide increase of 38 percent. These trends indicate a persistent challenge in preventing vehicles from leaving their intended travel lanes.
Figure 4.3 | Lane Departure Fatal and Serious Injury Crashes (2018–2022)
Source: MassDOT IMPACT Portal.
The causes of lane departure crashes are multifaceted, ranging from environmental characteristics (such as lighting and weather conditions) and roadway attributes (such as curvature and grade) to driver behavior. Contributing factors include:
Additionally, dangerous driver behaviors were found to greatly increase the risk of lane departure crashes. More than half (51 percent) of fatal and serious injury crashes involving impaired driving and nearly half (46 percent) of speeding-related fatal and serious injury crashes ended in a lane departure. As shown in Table 4.1, lane departures normally make up 21 percent of all fatal and serious injury crashes. Therefore, impaired driving or speeding doubles the chance of having a fatal or serious injury lane departure crash, emphasizing the importance of context-sensitive roadway design and awareness efforts targeting these high-risk behaviors.
As drivers age, physical and cognitive changes that are part of the normal aging process can affect their ability to drive safely and make them more vulnerable to fatal and serious injuries. Many features of the current roadway systems, licensing practices, and vehicles were not originally designed to accommodate older drivers. Within the region, 21 percent of fatal and serious injury crashes involved older drivers (drivers aged 65 and older), slightly higher than the statewide share of 20 percent, which underscore the safety concerns for this particular demographic.
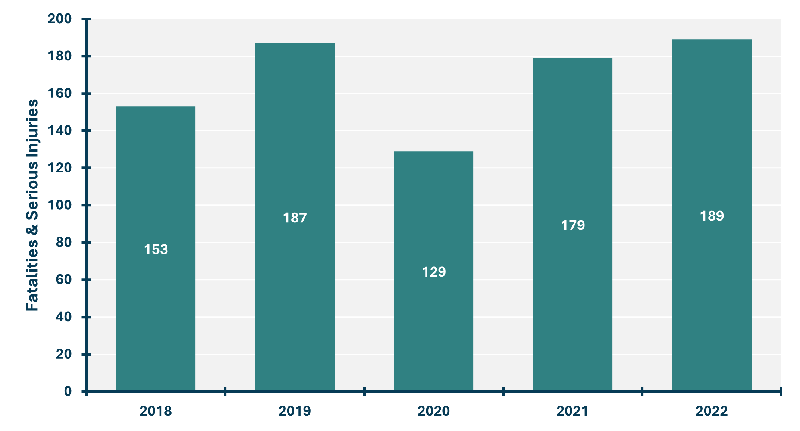
As demonstrated in the five-year trend in Figure 4.4, fatal and serious injury crashes involving older drivers first experienced a drastic increase of 22 percent in 2019 compared to the 2018, followed by a 31 percent decline in 2020 due to pandemic-related impacts, and then quickly rebounded to 2019 levels within the next two years. Overall, the rate of increase in older driver-related fatal and serious injury crashes over the five-year period slightly outpaced the statewide rate, indicating a growing need for targeted safety interventions.
Figure 4.4 | Older Driver Fatal and Serious Injury Crashes (2018–2022)
Source: MassDOT IMPACT Portal.
Several key factors can contribute to the increased risk of fatal and serious injury crashes involving older drivers. These include age-related declines in physical and cognitive function, underlying medical conditions, individual driving habits, and limitations in roadway design and vehicle features.12
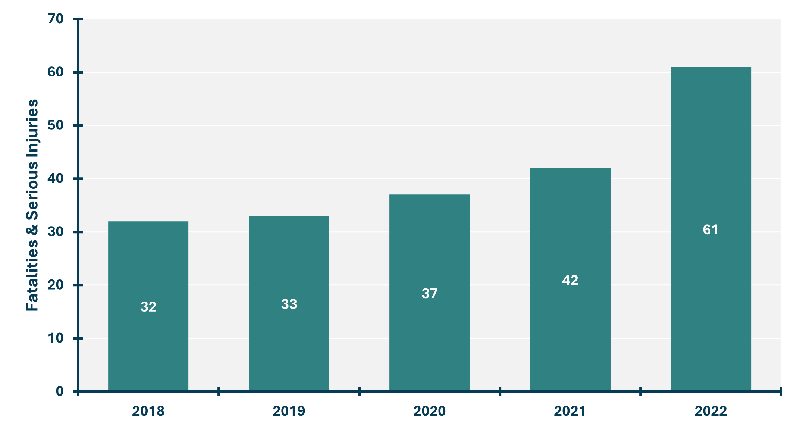
Speeding has consistently been identified as a contributing factor to fatal and serious injury crashes by stakeholders in the region. While speed-involved crashes only accounted for a small proportion (5 percent) of the total fatal and serious injury crashes, the Boston region experienced a substantial 91 percent increase in these crashes from 2018 to 2022. Although a similar increase (85 percent) was observed statewide, addressing speeding-related issues remains a critical priority for the region.
The yearly variation in speeding-related fatal and serious injury crashes is shown in Figure 4.5. Mirroring the upward trend in lane departure crashes, speeding-related fatal and serious injury crashes also exhibited a consistent increase over the five-year period. Notably, 2022 recorded the highest year-over-year growth rate of 45 percent.
Figure 4.5 | Speeding-Related Fatal and Serious Injury Crashes (2018–2022)
Source: MassDOT IMPACT Portal.
As previously discussed in the lane departure emphasis area, speeding behavior can be a significant contributing factor to lane departures, given that nearly half of speeding-related fatal and serious injury crashes also involved a lane departure. Additionally, speeding was also found to be prevalent in severe crashes involving impaired driving and motorcyclists. In fatal and serious injury crashes, impaired drivers were three times more likely to be speeding compared to non-impaired drivers (14 percent vs. 5 percent), and motorcyclists were observed to have almost double the percentage of speeding compared to car drivers (9 percent vs. 5 percent). Further analysis of potential risk factors associated with speeding-related fatal and serious injury crashes suggests that:
Based on the MassDOT HSIP emphasis area definition, large vehicles include buses, single-unit trucks, and tractor-trailers. From 2018 to 2022, large vehicles were involved in 5.4 percent of fatal and serious injury crashes, slightly higher than the statewide percentage of 5.3 percent. Of the 215 large vehicle-related fatal and serious injury crashes recorded during this period, 17 percent involved buses, 41 percent involved single-unit trucks, and 31 percent involved at least one tractor-trailer.
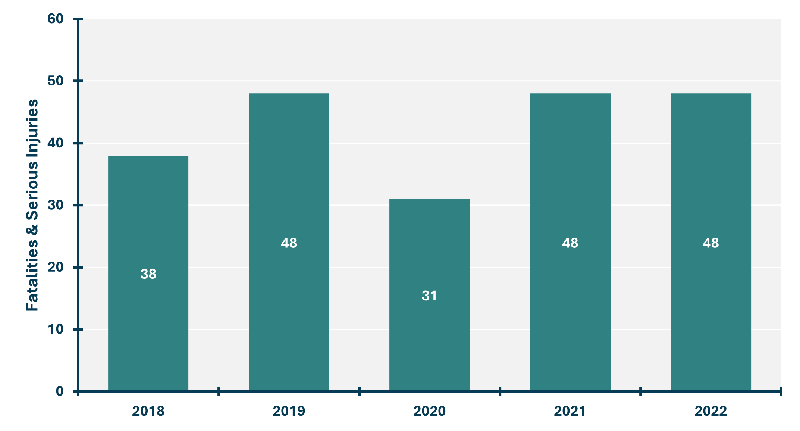
As illustrated in Figure 4.6, the number of fatal and serious injury crashes involving large vehicles rose by 26 percent from 2018 to 2019, followed by a 35 percent decline in 2020, likely due to reduced overall traffic. From 2020 to 2022, the number of such crashes remained steady at 48 per year. Overall, the number of large vehicle-related fatal and serious injury crashes in the region has been increasing at a slower rate compared to the statewide trend.
Between 2018 and 2022, 263 people were killed or seriously injured in crashes involving large vehicles. 56 percent of them were vehicle drivers, 23 percent were passengers, and 21 percent were VRUs.
Figure 4.6 | Large-Vehicle-Related Fatal and Serious Injury Crashes (2018–2022)
Source: MassDOT IMPACT Portal.
Potential contributing factors identified for large vehicle-related fatal and serious injury crashes include:
The Boston region is divided into eight subregions to promote coordination among local cities and towns and to better understand transportation needs in each subregion. While previous sections of this report focused on the entire region, it is important to recognize the potential of significant variations at more local levels. To gain a more detailed understanding of the unique safety challenges faced by each subregion and to inform the development of more effective and locally adapted safety strategies, this section examines the existing safety performance and identifies top emphasis areas for each of the eight subregions.
The eight subregions in the Boston Region MPO are listed below.
Key takeaways for this section include:
Key Takeaways
Table 5.1 shows a summary of the eight subregions within the MPO’s planning area. Both total crashes, regardless of severity, and fatal and serious injury crashes are summarized. For both the total crashes and the total fatal and serious injury crash categories, the following information is presented:
Unsurprisingly, the ICC Subregion, which has the largest population of all subregions, has both the highest number of fatal and serious injury crashes with over 2,000 fatal and serious injury crashes (over 50 percent of the fatal and serious injury crashes in the entire region) as well as the highest number of total crashes with over 78,000 (42 percent of the entire region). However, despite these high overall numbers, the ICC Subregion has the lowest rate of total crashes per 100,000 residents (4,459) and the third-lowest rate of fatal and serious injury crashes per 100,000 residents (117.3).
The MetroWest and SWAP Subregions have the highest rates for all crashes (8,637 and 8,546 crashes per 100,000 residents respectively) and the SWAP and SSC Subregions have the highest rates for fatal and serious injury crashes (147.7 and 133.0 respectively). These three Subregions consist more of rural and suburban-style land uses compared to the urban nature of the ICC, which could explain some of the difference as more rural areas tend to have higher amounts of driving (VMT per capita), which leads to higher rates of crashes per capita. Per MassDOT Vehicle Census data, these three regions each average over 8,000 VMT per resident, higher than the regionwide average of approximately 6,500 VMT per resident.
Similar to the entire region, each subregion is experiencing a decline in the total number of crashes of all severities. The NSPC, MetroWest, and MAGIC regions all decreased their total number of crashes by over 13 percent from 2018 to 2022. This trend contrasts with the total number of fatal and serious injury crashes specifically; every subregion is experiencing an increasing trend for total and serious injury crashes except for the NSTF Subregion. The SSC, SWAP, and NSPC subregions are all the fastest growing subregions in terms of the number of fatal and serious injury crashes with each growing over 45 percent. The SWAP Subregion, in particular, has almost doubled the total number of fatal and serious injury crashes from 2018 to 2022. The SWAP Subregion is also the fastest growing subregion in terms of population, but the 2 percent increase in population over this time period does not fully explain the increase in fatal and serious injury crashes.
Table 5.1 | Subregion Summary (2018–2022)
| Subregion |
Total Crashes |
Fatal & Serious Injury Crashes |
||||||
|---|---|---|---|---|---|---|---|---|
| Number |
% of Total |
% Change (’18-’22) |
Per 100K Residents |
Number |
% of Total |
% Change (’18-’22) |
Per 100K Residents |
|
Inner Core Committee (ICC) |
78,485 |
41.6% |
-7.0% |
4,459 |
2,065 |
51.8% |
2.6% |
117.3 |
Minuteman Advisory Group on Interlocal Coordination (MAGIC) |
11,675 |
6.2% |
-13.2% |
6,420 |
193 |
4.8% |
2.3% |
106.1 |
MetroWest Regional Collaborative (MetroWest) |
21,659 |
11.5% |
-15.0% |
8,637 |
296 |
7.4% |
4.5% |
118.0 |
North Suburban Planning Council (NSPC) |
13,965 |
7.4% |
-17.8% |
6,407 |
257 |
6.5% |
63.4% |
117.9 |
North Shore Task Force (NSTF) |
18,369 |
9.7% |
-0.6% |
6,183 |
314 |
7.9% |
-8.6% |
105.7 |
South Shore Coalition (SSC) |
14,412 |
7.6% |
-1.5% |
6,412 |
299 |
7.5% |
45.5% |
133.0 |
SouthWest Advisory Planning Committee (SWAP) |
13,253 |
7.0% |
-9.6% |
8,546 |
229 |
5.7% |
96.9% |
147.7 |
Three Rivers Interlocal Council (TRIC) |
16,718 |
8.9% |
-8.2% |
6,199 |
331 |
8.3% |
-7.6% |
122.7 |
Total |
188,536 |
100.0% |
-8.5% |
5,616 |
3,984 |
100.0% |
20.3% |
118.7 |
Source: Crashes from the MassDOT IMPACT Portal; 2020 population estimates from the US Census Bureau.
Note: Numbers in the Total row may differ from other tables and figures due to inconsistent data availability for certain fields.
Table 5.2 shows the top emphasis areas for each subregion, numbered in order. The top emphasis areas were found using two different methods:
The top three emphasis areas by the total number of fatal and serious injury crashes for each subregion almost universally align with the top three emphasis areas for the region. All subregions except the ICC Subregion have the same top three emphasis areas, and the Intersection emphasis area is the top in every region. The only outlier is the Pedestrians emphasis area in the ICC Subregion, which contains much of the urban core and the highest pedestrian mode share.
The top three over-represented emphasis areas vary from subregion-to-subregion, each reflecting their different unique characteristics and crash circumstances. The Lane Departure emphasis area is over-represented in every subregion except the ICC Subregion, emphasizing the importance of lane departures in the more suburban communities. In the ICC Subregion, every over-represented emphasis area (Pedestrians, Intersections, Bicyclists) is unique among all the other subregions, highlighting the unique crash history in the region’s core.
Unique instances of over-represented emphasis areas not within the six key emphasis areas identified in Section 4 include:
Table 5.2 | Notable Subregion Emphasis Areas (2018–2022)
| Subregion |
Top 3 Emphasis Areas by Fatal & Serious Injury Crashes |
Top 3 Over-Represented Emphasis Areas by Fatal & Serious Injury Crashes |
|---|---|---|
Inner Core Committee (ICC) |
1. Intersections |
1. Pedestrians |
Minuteman Advisory Group on Interlocal Coordination (MAGIC) |
1. Intersections |
1. Lane Departure |
MetroWest Regional Collaborative (MetroWest) |
1. Intersections |
1. Lane Departure |
North Suburban Planning Council (NSPC) |
1. Intersections |
1. Lane Departure |
North Shore Task Force (NSTF) |
1. Intersections |
1. Lane Departure |
South Shore Coalition (SSC) |
1. Intersections |
1. Lane Departure |
SouthWest Advisory Planning Committee (SWAP) |
1. Intersections |
1. Motorcycle |
Three Rivers Interlocal Council (TRIC) |
1. Intersections |
1. Older Drivers |
Source: MassDOT IMPACT Portal.
More detail for each subregion will be available in the Subregional Profiles, which will contain more in-depth analysis of emphasis areas, contributing factors, and specific crash types within each subregion.
The MPO region encompasses 97 cities and towns, stretching from Boston to Ipswich in the north, Marshfield in the south, and to approximately Interstate 495 in the west. Building upon the regional and subregional analyses of safety performance over the past five years, this section focuses on investigating the existing conditions at the municipal level. The top 10 municipalities with the highest number of fatal and serious injury crashes and the top 10 municipalities with the highest fatal and serious injury crash rates are summarized here. Similar to Section 5, each of the municipalities has an overview of crashes and the identification of top emphasis areas. By identifying municipalities with the most significant fatal and serious injury crash concerns, the region can prioritize safety investments in those areas of greatest need to maximize the potential safety impacts.
Key takeaways for this section include:
Key Takeaways
Table 6.1 and Table 6.2 show a summary of the 10 municipalities in the region with the most fatal and serious injury crashes and the highest fatal and serious injury crash rates, respectively.14 Both total crashes, regardless of severity, and fatal and serious injury crashes are summarized. For both the total crashes and the total fatal and serious injury crash categories, the following information is presented:
In general, out of the top 10 municipalities shown in Table 6.1, the municipalities with the highest numbers of fatal and serious injury crashes (Boston, Lynn, Quincy, and Cambridge) are decreasing while the those with lower numbers are increasing (Newton, Revere, Malden, Chelsea, Framingham, and Weymouth). Chelsea has experienced a surge in fatal and serious injury crashes in recent years, almost doubling from 12 in 2018 to 23 in 2022. Weymouth (90 percent) and Framingham (73 percent) have also experienced significant increases in recent years.
The top 10 municipalities shown in Table 6.2 are generally municipalities that are on the outer edges of the region and are more suburban in land use compared to the core of the region. The exceptions to this are Lynn, Saugus, and Chelsea, all denser municipalities north of Boston. For the other seven towns, this suggests a link between some of the land uses and policies of the outer suburban region as it relates to higher crash rates. For Lynn, Saugus, and Chelsea, more study is needed to identify potential causes for the higher-than-expected crash rates.
Table 6.1 | Top 10 Municipalities by Fatal & Serious Injury Crashes (2018–2022)
| Municipality |
Total Crashes |
Fatal & Serious Injury Crashes |
||||||
|---|---|---|---|---|---|---|---|---|
| Number |
% of Total |
% Change |
Per 100K Residents |
Number |
% of Total |
% Change |
Per 100K Residents |
|
Boston1 |
10,362 |
5.5% |
-22.1% |
1,527 |
320 |
8.0% |
-58.3% |
47 |
Lynn |
9,363 |
5.0% |
-0.7% |
9,246 |
237 |
5.9% |
-39.7% |
234 |
Quincy |
8,622 |
4.6% |
-7.2% |
8,485 |
155 |
3.9% |
-9.1% |
153 |
Cambridge |
6,872 |
3.6% |
-7.3% |
5,804 |
129 |
3.2% |
-22.6% |
109 |
Newton |
6,016 |
3.2% |
-14.9% |
6,763 |
115 |
2.9% |
33.3% |
129 |
Revere |
3,043 |
1.6% |
-8.5% |
4,892 |
92 |
2.3% |
38.9% |
148 |
Malden |
4,157 |
2.2% |
-0.7% |
6,273 |
87 |
2.2% |
50.0% |
131 |
Chelsea |
3,557 |
1.9% |
7.3% |
8,722 |
83 |
2.1% |
91.7% |
204 |
Framingham |
6,494 |
3.4% |
-6.4% |
8,972 |
83 |
2.1% |
73.3% |
115 |
Weymouth |
4,685 |
2.5% |
4.6% |
8,156 |
79 |
2.0% |
90.0% |
138 |
Total |
63,171 |
33.5% |
-8.1% |
4,552 |
1,380 |
34.6% |
-25.0% |
99 |
1 Due to crash reporting issues, the total number of crashes and fatal and serious injury crashes for the City of Boston are under-reported to the Registry of Motor Vehicles (RMV). The true crash rates in the City are estimated to be higher than shown in Table 6.1.
Source: Crashes from the MassDOT IMPACT Portal; 2020 population estimates from the US Census Bureau.
Table 6.2 | Top 10 Municipalities by Fatal & Serious Injury Crash Rate (2018–2022)
| Municipality |
Total Crashes |
Fatal & Serious Injury Crashes |
||||||
|---|---|---|---|---|---|---|---|---|
| Number |
% of Total |
% Change |
Per 100K Residents |
Number |
% of Total |
% Change |
Per 100K Residents |
|
Sherborn |
700 |
0.4% |
-13.2% |
15,902 |
19 |
0.5% |
200.0% |
431 |
Wrentham |
1,148 |
0.6% |
-11.3% |
9,430 |
44 |
1.1% |
55.6% |
361 |
Dover |
445 |
0.2% |
-42.7% |
7,512 |
16 |
0.4% |
-33.3% |
270 |
Millis |
478 |
0.3% |
4.7% |
5,651 |
21 |
0.5% |
50.0% |
248 |
Middleton |
898 |
0.5% |
26.7% |
9,182 |
24 |
0.6% |
33.3% |
245 |
Lynn |
9,363 |
5.0% |
-0.7% |
9,246 |
237 |
5.9% |
-39.7% |
234 |
Rockland |
1,056 |
0.6% |
-3.8% |
5,931 |
38 |
1.0% |
-11.1% |
213 |
Topsfield |
388 |
0.2% |
36.4% |
5,913 |
14 |
0.4% |
33.3% |
213 |
Saugus |
2,593 |
1.4% |
22.4% |
9,061 |
61 |
1.5% |
-38.5% |
213 |
Chelsea |
3,557 |
1.9% |
7.3% |
8,722 |
83 |
2.1% |
91.7% |
203 |
Total |
20,626 |
10.9% |
1.7% |
8,748 |
557 |
14.0% |
-18.0% |
236.2 |
Source: Crashes from the MassDOT IMPACT Portal; 2020 population estimates from the US Census Bureau.
Table 6.3 and Table 6.4 show the top emphasis areas, numbered in order, for each municipality identified in Table 6.1 and Table 6.2, respectively. The top emphasis areas were found using two different methods:
Refer to theEmphasis Areas by Subregion portion of Section 5 for a more detailed explanation of each of these methods.
Similar to Section 5, the top three emphasis areas by the total number of fatal and serious injury crashes almost completely align with the key emphasis areas (Intersections, Lane Departure, Pedestrians/Bicyclists, Older Drivers, Speeding, and Large Vehicles) for the entire region. The only outliers include the Younger Drivers emphasis area in Chelsea, the Motorcyclists emphasis area in Framingham and Wrentham, and the Occupant Protection emphasis area in Rockland. Also of note is the Bicyclist emphasis area in Cambridge, which is the only instance of that emphasis area in the list of top 10 municipalities. This likely reflects the higher bicyclist mode share in the city’s multiple college campuses.
The top three over-represented emphasis areas vary by municipality; but in general, the most common over-represented emphasis areas are the Intersections, Pedestrians, Impaired Driving, Speeding, and Occupant Protection emphasis areas. Other over-represented emphasis areas include:
Table 6.3 | Notable Emphasis Areas of the Top 10 Municipalities by the Number of Fatal & Serious Injury Crashes (2018–2022)
| Municipality |
Top 3 Emphasis Areas by Number of Fatal & Serious Injury Crashes |
Top 3 Over-Represented Emphasis Areas by Fatal & Serious Injury Crashes |
|---|---|---|
Boston |
1. Intersections |
1. Pedestrians |
Lynn |
1. Intersections |
1. Intersections |
Quincy |
1. Intersections |
1. Pedestrians |
Cambridge |
1. Intersections |
1. Bicyclists |
Newton |
1. Intersections |
1. Bicyclists |
Revere |
1. Intersections |
1. Pedestrians |
Malden |
1. Intersections |
1. Intersections |
Chelsea |
1. Intersections |
1. Pedestrians |
Framingham |
1. Intersections |
1. Speeding |
Weymouth |
1. Intersections |
1. Older Drivers |
Source: MassDOT IMPACT Portal.
Table 6.4 | Notable Emphasis Areas of the Top 10 Municipalities by Fatal & Serious Injury Crash Rate (2018–2022)
| Municipality |
Top 3 Emphasis Areas by Number of Fatal & Serious Injury Crashes |
Top 3 Over-Represented Emphasis Areas by Fatal & Serious Injury Crashes |
|---|---|---|
Sherborn |
1. Lane Departures |
1. Lane Departures |
Wrentham |
1. Intersections |
1. Occupant Protection |
Dover |
1. Lane Departures |
1. Lane Departures |
Millis |
1. Lane Departures |
1. Lane Departures |
Middleton |
1. Lane Departures |
1. Lane Departures |
Lynn |
1. Intersections |
1. Intersections |
Rockland |
1. Intersections |
1. Occupant Protection |
Topsfield |
1. Intersections |
1. Occupant Protection |
Saugus |
1. Lane Departures |
1. Large Vehicles |
Chelsea |
1. Intersections |
1. Pedestrians |
Source: MassDOT IMPACT Portal
This existing conditions analysis provides the foundation for future data analysis, policy evaluation, and strategy selection. Findings offer a snapshot of roadway safety in the region, which may be used in public and stakeholder engagement, such as Task Force meetings, MPO Board meetings, and virtual municipal roundtables.
The systemic safety analysis subtask will build upon these findings and may identify additional Emphasis Areas for the Vision Zero Action Plan. That task will identify specific factors that may be overrepresented across the region and highlight the most common roadway safety challenges in each subregion by characteristics of crash, roadway types, and contributing factors to crashes. The systemic safety task will also draw upon key takeaways and safety challenges identified by state and local government stakeholders and the public. Existing conditions will help inform the development of MPO Subregion safety profiles that describe the common infrastructure, behavioral, operational, and modal safety problems in the region. By combining existing conditions, the High Injury Network (HIN) and high-risk networks, and stakeholder and public engagement findings, a prioritized list of locations will be identified for consideration in the strategy and project selection task.
Strategies will span roadway design, policy and process changes, education and stakeholder coordination, and emergency response recommendations to address the top identified safety challenges. The existing conditions analysis will directly feed into the prioritization of policy recommendations, and changes or improvements that municipalities, the MPO, and the Commonwealth can pursue to support roadway safety. The data analysis can also inform the development of location-specific projects, as well as region-wide systemic solutions to address the region’s top safety problems.
1 Ramp crashes were identified and removed from the dataset by searching for the word “Ramp” in the Street Name field from the MassDOT IMPACT data.
2 Location information primarily came from a file maintained by the MPO, available at https://raw.githubusercontent.com/CTPSSTAFF/geocrosswalks/main/output/muni_info.csv.
3 According to the NHTSA, contributing factors to historical declines in fatalities may have included passenger vehicle safety enhancements and increases in seatbelt use. Source: https://crashstats.nhtsa.dot.gov/Api/Public/ViewPublication/811368
4 Zero Deaths and Safe System, the FHWA. Source: https://highways.dot.gov/safety/zero-deaths
5 As stated in Section 1, the summaries in this section do not include crashes on access-controlled roadways.
6 Crash Costs for Highway Safety Analysis, MassDOT. Source: https://www.mass.gov/info-details/crash-costs-for-highway-safety-analysis.
7 Enhancing Nighttime Safety for All Roadway Users, NHTSA. Source: https://highways.dot.gov/sites/fhwa.dot.gov/files/2024-02/FHWA-SA-23-021_Nighttime%20Safety.pdf.
8 Vulnerable Road Users (VRUs) are pedestrians on foot or on a mobility-assistance device, a bicyclist or other cyclist, or a person on a personal conveyance vehicle. Motorcyclists are not considered as VRUs for the purpose of this analysis.
9 The Department of Conservation & Recreation maintains select roads and parkways in the Commonwealth of Massachusetts, such as Storrow Drive, Jamaicaway, Veterans of Foreign Wars Parkway, and more.
10 Massachusetts Vehicle Census, MassDOT. Source: https://geodot-homepage-massdot.hub.arcgis.com/pages/massvehiclecensus.
11 Massachusetts Highway Safety Improvement Program, MassDOT. Source: https://www.mass.gov/info-details/highway-safety-improvement-program
12 Traffic Safety Facts: Older Population, the NHTSA. Source: https://crashstats.nhtsa.dot.gov/Api/Public/ViewPublication/813616.
13 Performing a two-proportion z-test comparing the 24.4 percent share of pedestrian fatal & serious injury crashes in the ICC Subregion to the 19.6 percent share in the region yields a p-value of less than 0.01, which means the Pedestrian emphasis area is significantly over-represented in the ICC Subregion. The three emphasis areas with the lowest p-values are the three most over-represented emphasis areas for each subregion.
14 Per MassDOT IMPACT crash data, the City of Waltham has the highest number of fatal and serious injury crashes and the highest crash rate, but this is likely an over-counting error as the annual number of fatalities and serious injuries is, on average, over 10 times higher between 2019 – 2022 compared to 2013 – 2018. For this reason, Waltham is not included in Table 6.1 nor Table 6.2.